Maps
The Maps component lets you illustrate geographical data.
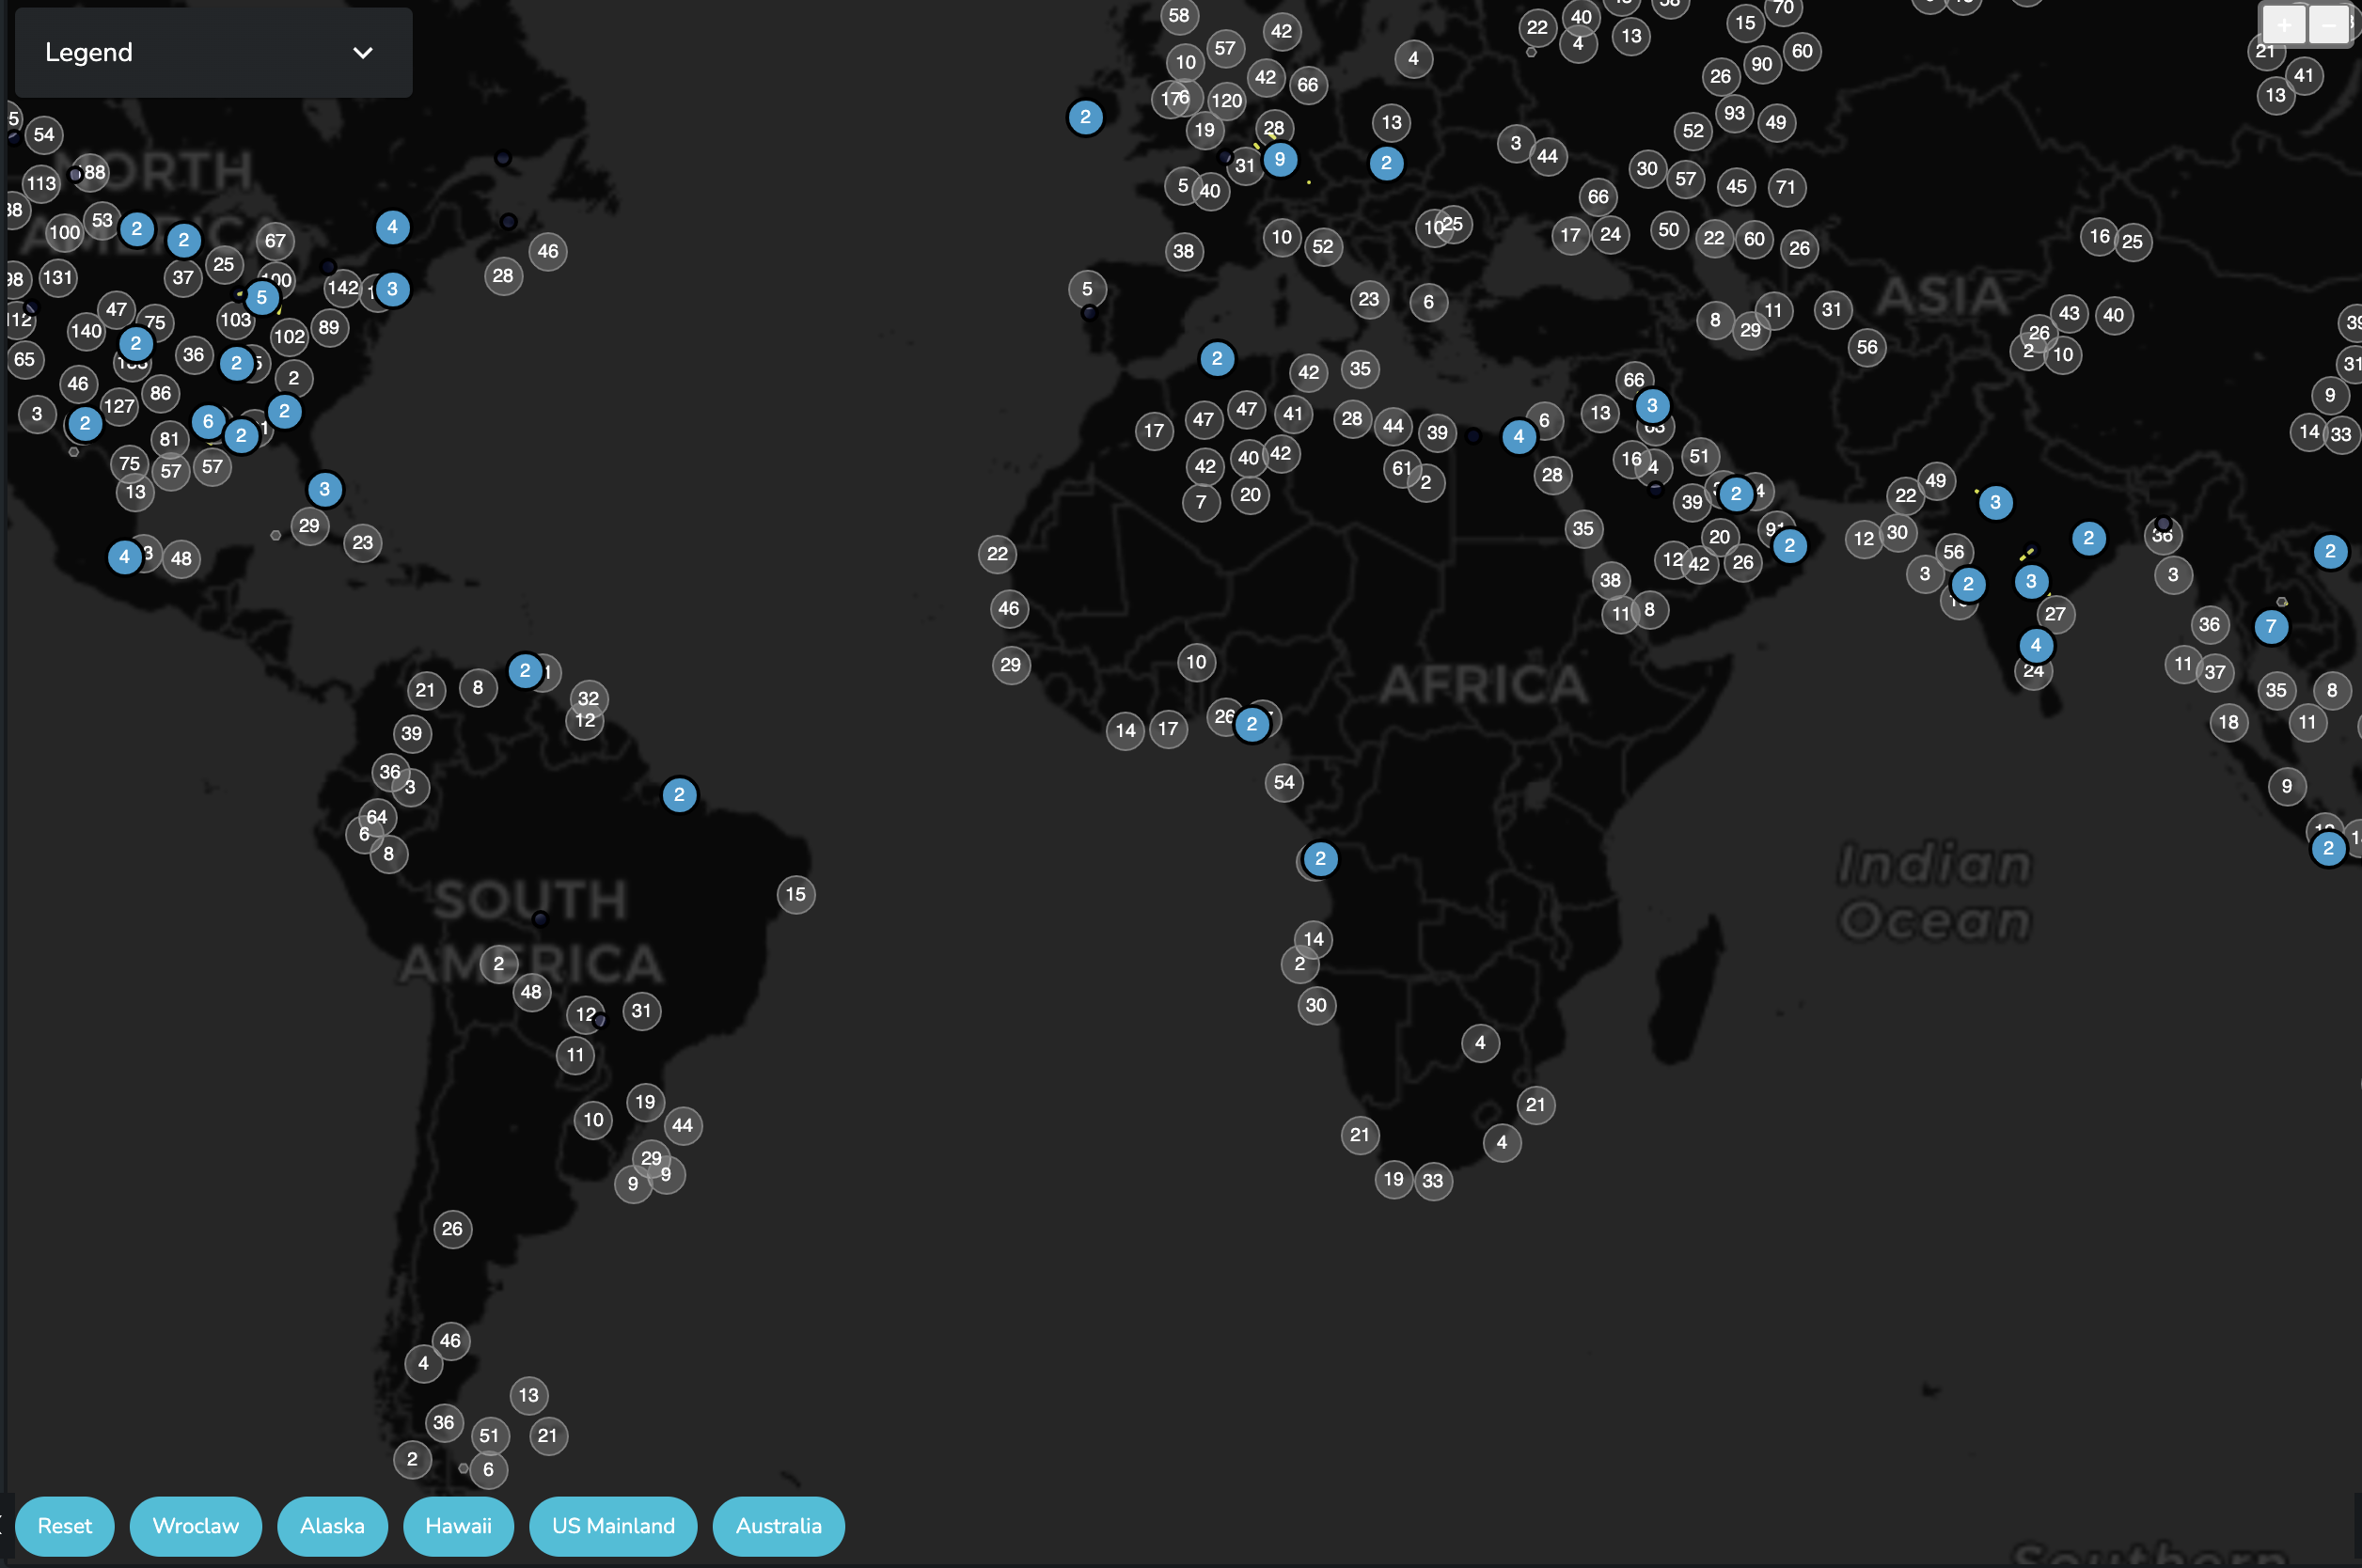
Displaying Data
Layers
The user can add different layers of data for the Maps component. The layers must contain data that is in turn displayed on the map based on their coordinates.
The available options for Layer Types are:
PointsShapesLinesFrom Tile Server
Point data
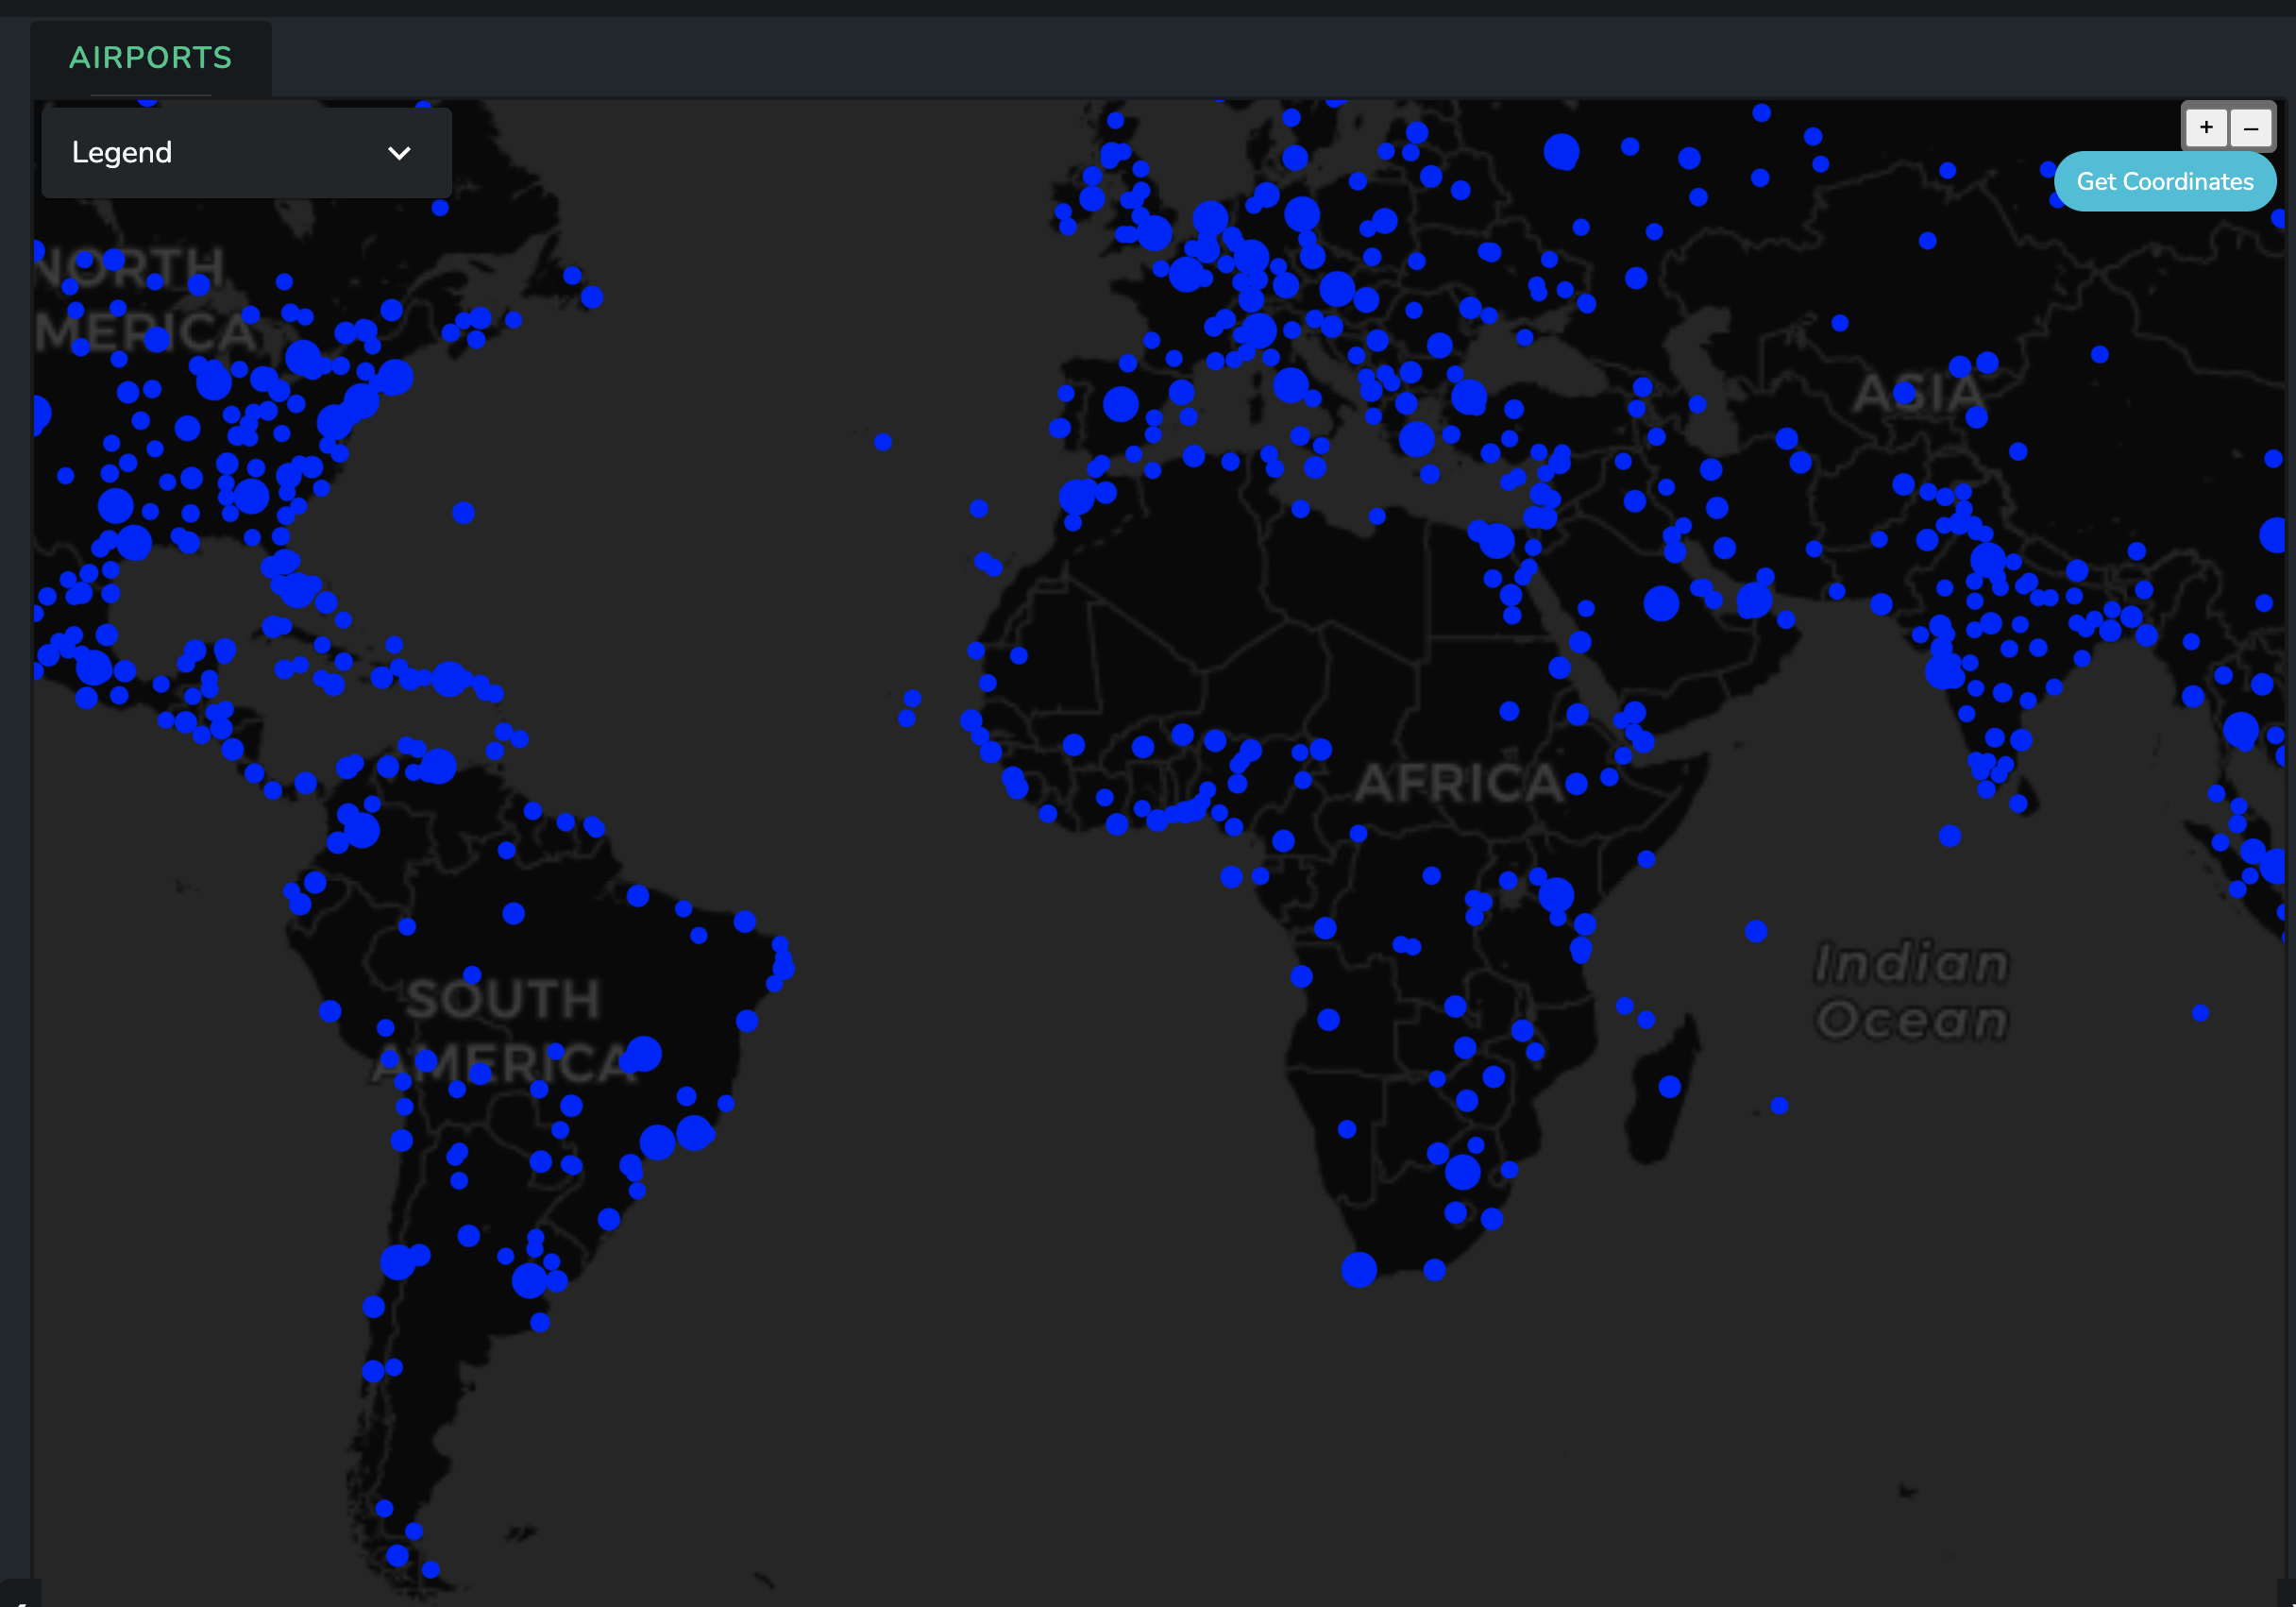
For example, to display a set of airports in the above example the layer data looks like the below:
{
  "type": "FeatureCollection",
  "features": [
    {
      "type": "Feature",
      "properties": {
        "scalerank": 9,
        "type": "small",
        "name": "Sahnewal",
        "abbrev": "LUH",
        "location": "terminal",
        "gps_code": "VILD",
        "iata_code": "LUH",
        "wikipedia": "http://en.wikipedia.org/wiki/Sahnewal_Airport",
        "natlscale": 8,
        "featureclass": "Airport"
      },
      "geometry": {
        "type": "Point",
        "coordinates": [
          75.95707224036518,
          30.850359856170176
        ]
      }
    },
    {
      "type": "Feature",
      "properties": {
        "scalerank": 9,
        "type": "mid",
        "name": "Solapur",
        "abbrev": "SSE",
        "location": "terminal",
        "gps_code": "VASL",
        "iata_code": "SSE",
        "wikipedia": "http://en.wikipedia.org/wiki/Solapur_Airport",
        "natlscale": 8,
        "featureclass": "Airport"
      },
      "geometry": {
        "type": "Point",
        "coordinates": [
          75.93305977107549,
          17.625415183635024
        ]
      }
    },
    {
      "type": "Feature",
      "properties": {
        "scalerank": 9,
        "type": "mid",
        "name": "Birsa Munda",
        "abbrev": "IXR",
        "location": "terminal",
        "gps_code": "VERC",
        "iata_code": "IXR",
        "wikipedia": "http://en.wikipedia.org/wiki/Birsa_Munda_Airport",
        "natlscale": 8,
        "featureclass": "Airport"
      }
    }
  ]
}
In order to display the above data the user has to specify the Data ID Key (gps_code in the above example) and
the Radius Key (natlscale in the above example).
Shapes
The Maps components allows the user to add custom shapes on the map when setting the Layer type to Shapes.
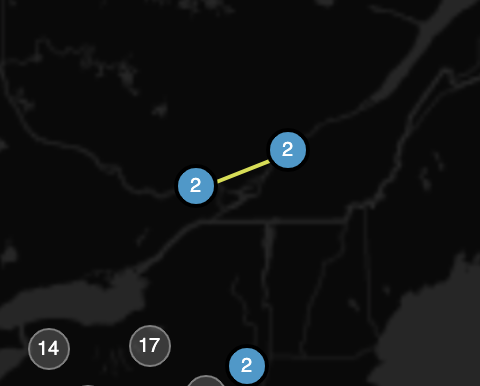
To show the aboe the user has to provide geo data with the type LineString like in the example below.
The user can also specify a color for the Stroke Color by picking a color from the standard Dais Color picker that is
using the colors applied to the app theme.
{
  "type": "FeatureCollection",
  "features": [
    {
      "type": "Feature",
      "geometry": {
        "type": "LineString",
        "coordinates": [
          [
            146.393265,
            -38.198805
          ],
          [
            146.415507320544,
            -38.2331963253188
          ]
        ]
      },
      "properties": {
        "n": 1,
        "id": "AUS_05",
        "layerName": "Clusters"
      }
    },
    {
      "type": "Feature",
      "geometry": {
        "type": "LineString",
        "coordinates": [
          [
            145.373333,
            -16.45
          ],
          [
            146.816906346892,
            -19.2590053748136
          ]
        ]
      },
      "properties": {
        "n": 1,
        "id": "AUS_07",
        "layerName": "Clusters"
      }
    }
  ]
}
Lines
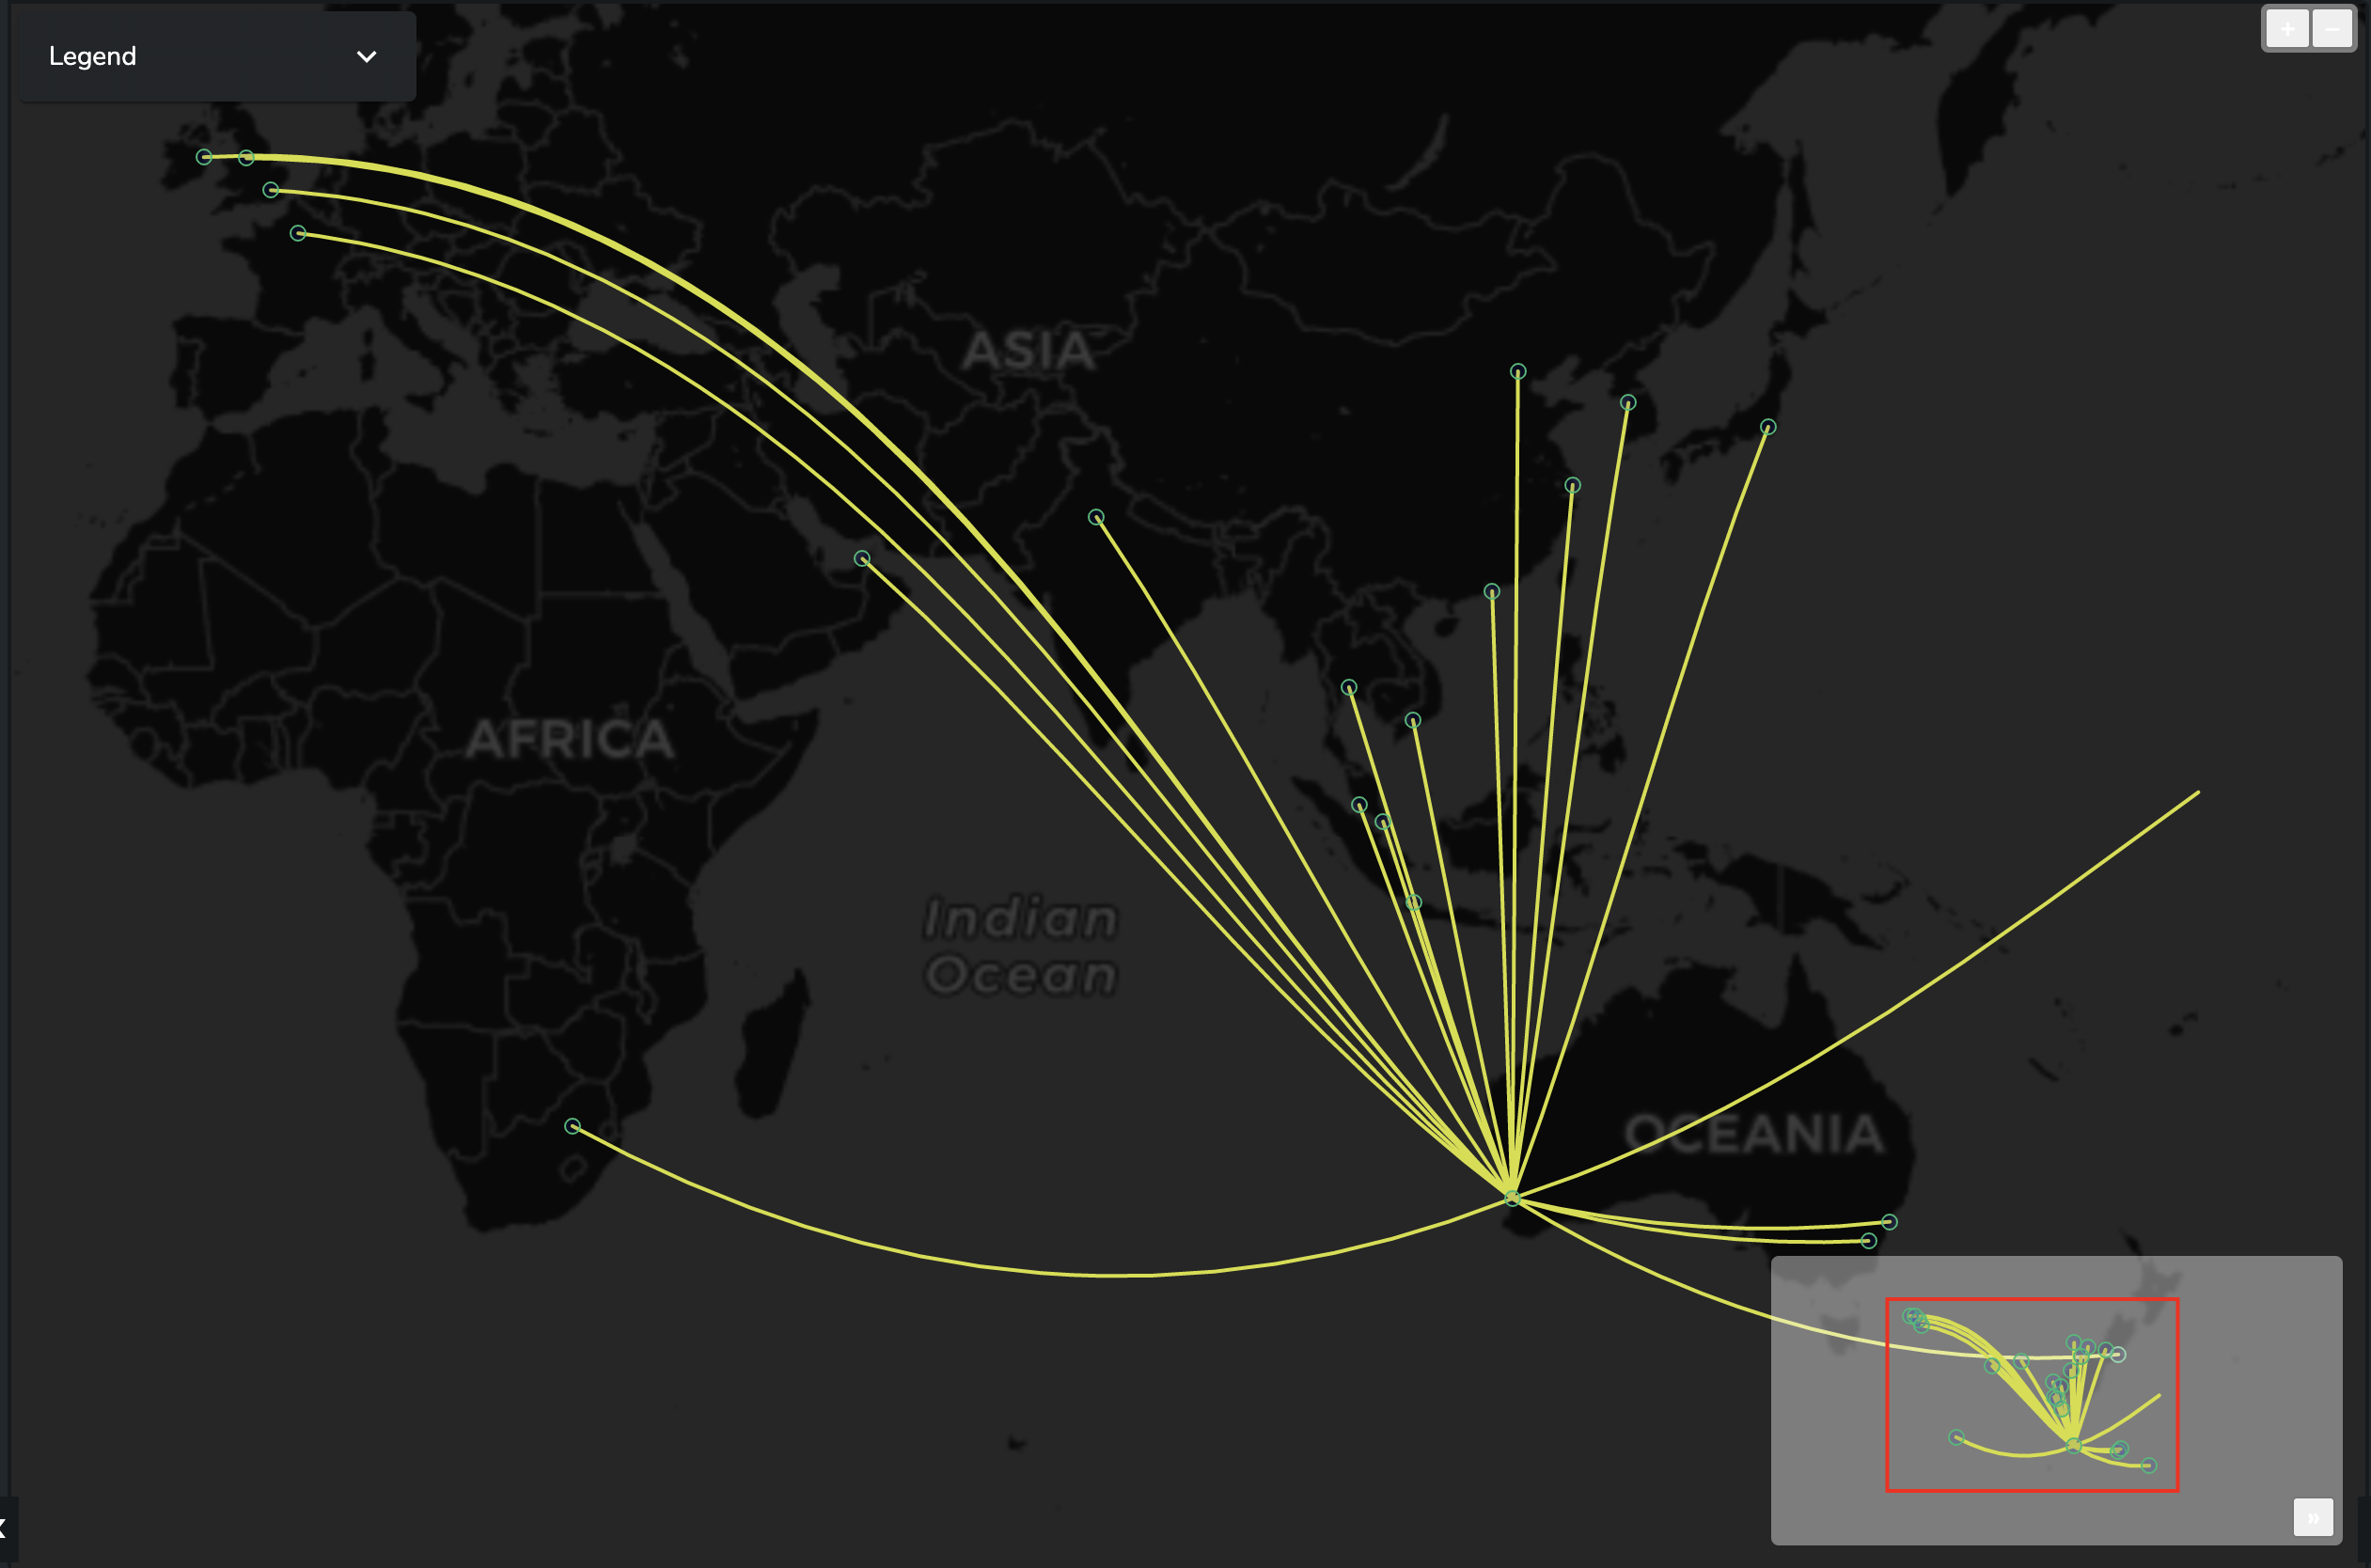
When the user sets the layer type to be Lines, both lines and points data must be provided.
Below you can find and example SDD points data but you can also use data of type geoJSON:
{
  "data": {
    "lat": [
      -32.01889991760254,
      -34.945,
      -37.008098602299995,
      39.79094826009114
    ],
    "long": [
      115.92399978637695,
      138.531006,
      174.792007446,
      116.4613065242513
    ],
    "city_code": [
      "PER",
      "ADL",
      "AKL",
      "BJS"
    ],
    "city_name": [
      "Perth",
      "Adelaide",
      "Auckland",
      "Beijing"
    ]
  },
  "version": "1.0.0",
  "sddFormat": "sdd/table/object-of-arrays",
  "validation": "enforced",
  "definitions": {
    "lat": {
      "kind": "number",
      "optional": false
    },
    "long": {
      "kind": "number",
      "optional": false
    },
    "city_code": {
      "kind": "string",
      "optional": false
    },
    "city_name": {
      "kind": "string",
      "optional": false
    }
  }
}
Example lines data:
{
  "data": {
    "origin_city_name": [
      "Perth",
      "Perth",
      "Perth"
    ],
    "destination_city_name": [
      "Adelaide",
      "Auckland",
      "Beijing"
    ]
  },
  "version": "1.0.0",
  "sddFormat": "sdd/table/object-of-arrays",
  "validation": "enforced",
  "definitions": {
    "origin_city_name": {
      "kind": "string",
      "optional": false
    },
    "destination_city_name": {
      "kind": "string",
      "optional": false
    }
  }
}
In the above example the user needs to specify the following points data keys:
Latitude Key->latLongtitude Key->longPoint Id Key->city_name
And the following line data keys:
Line Origin Key->origin_city_nameLine Destination Key->destination_city_name
Choropleth
The Maps component can be used to create different kinds of Choropleth maps by adding a Layer with custom shapes for different countries.
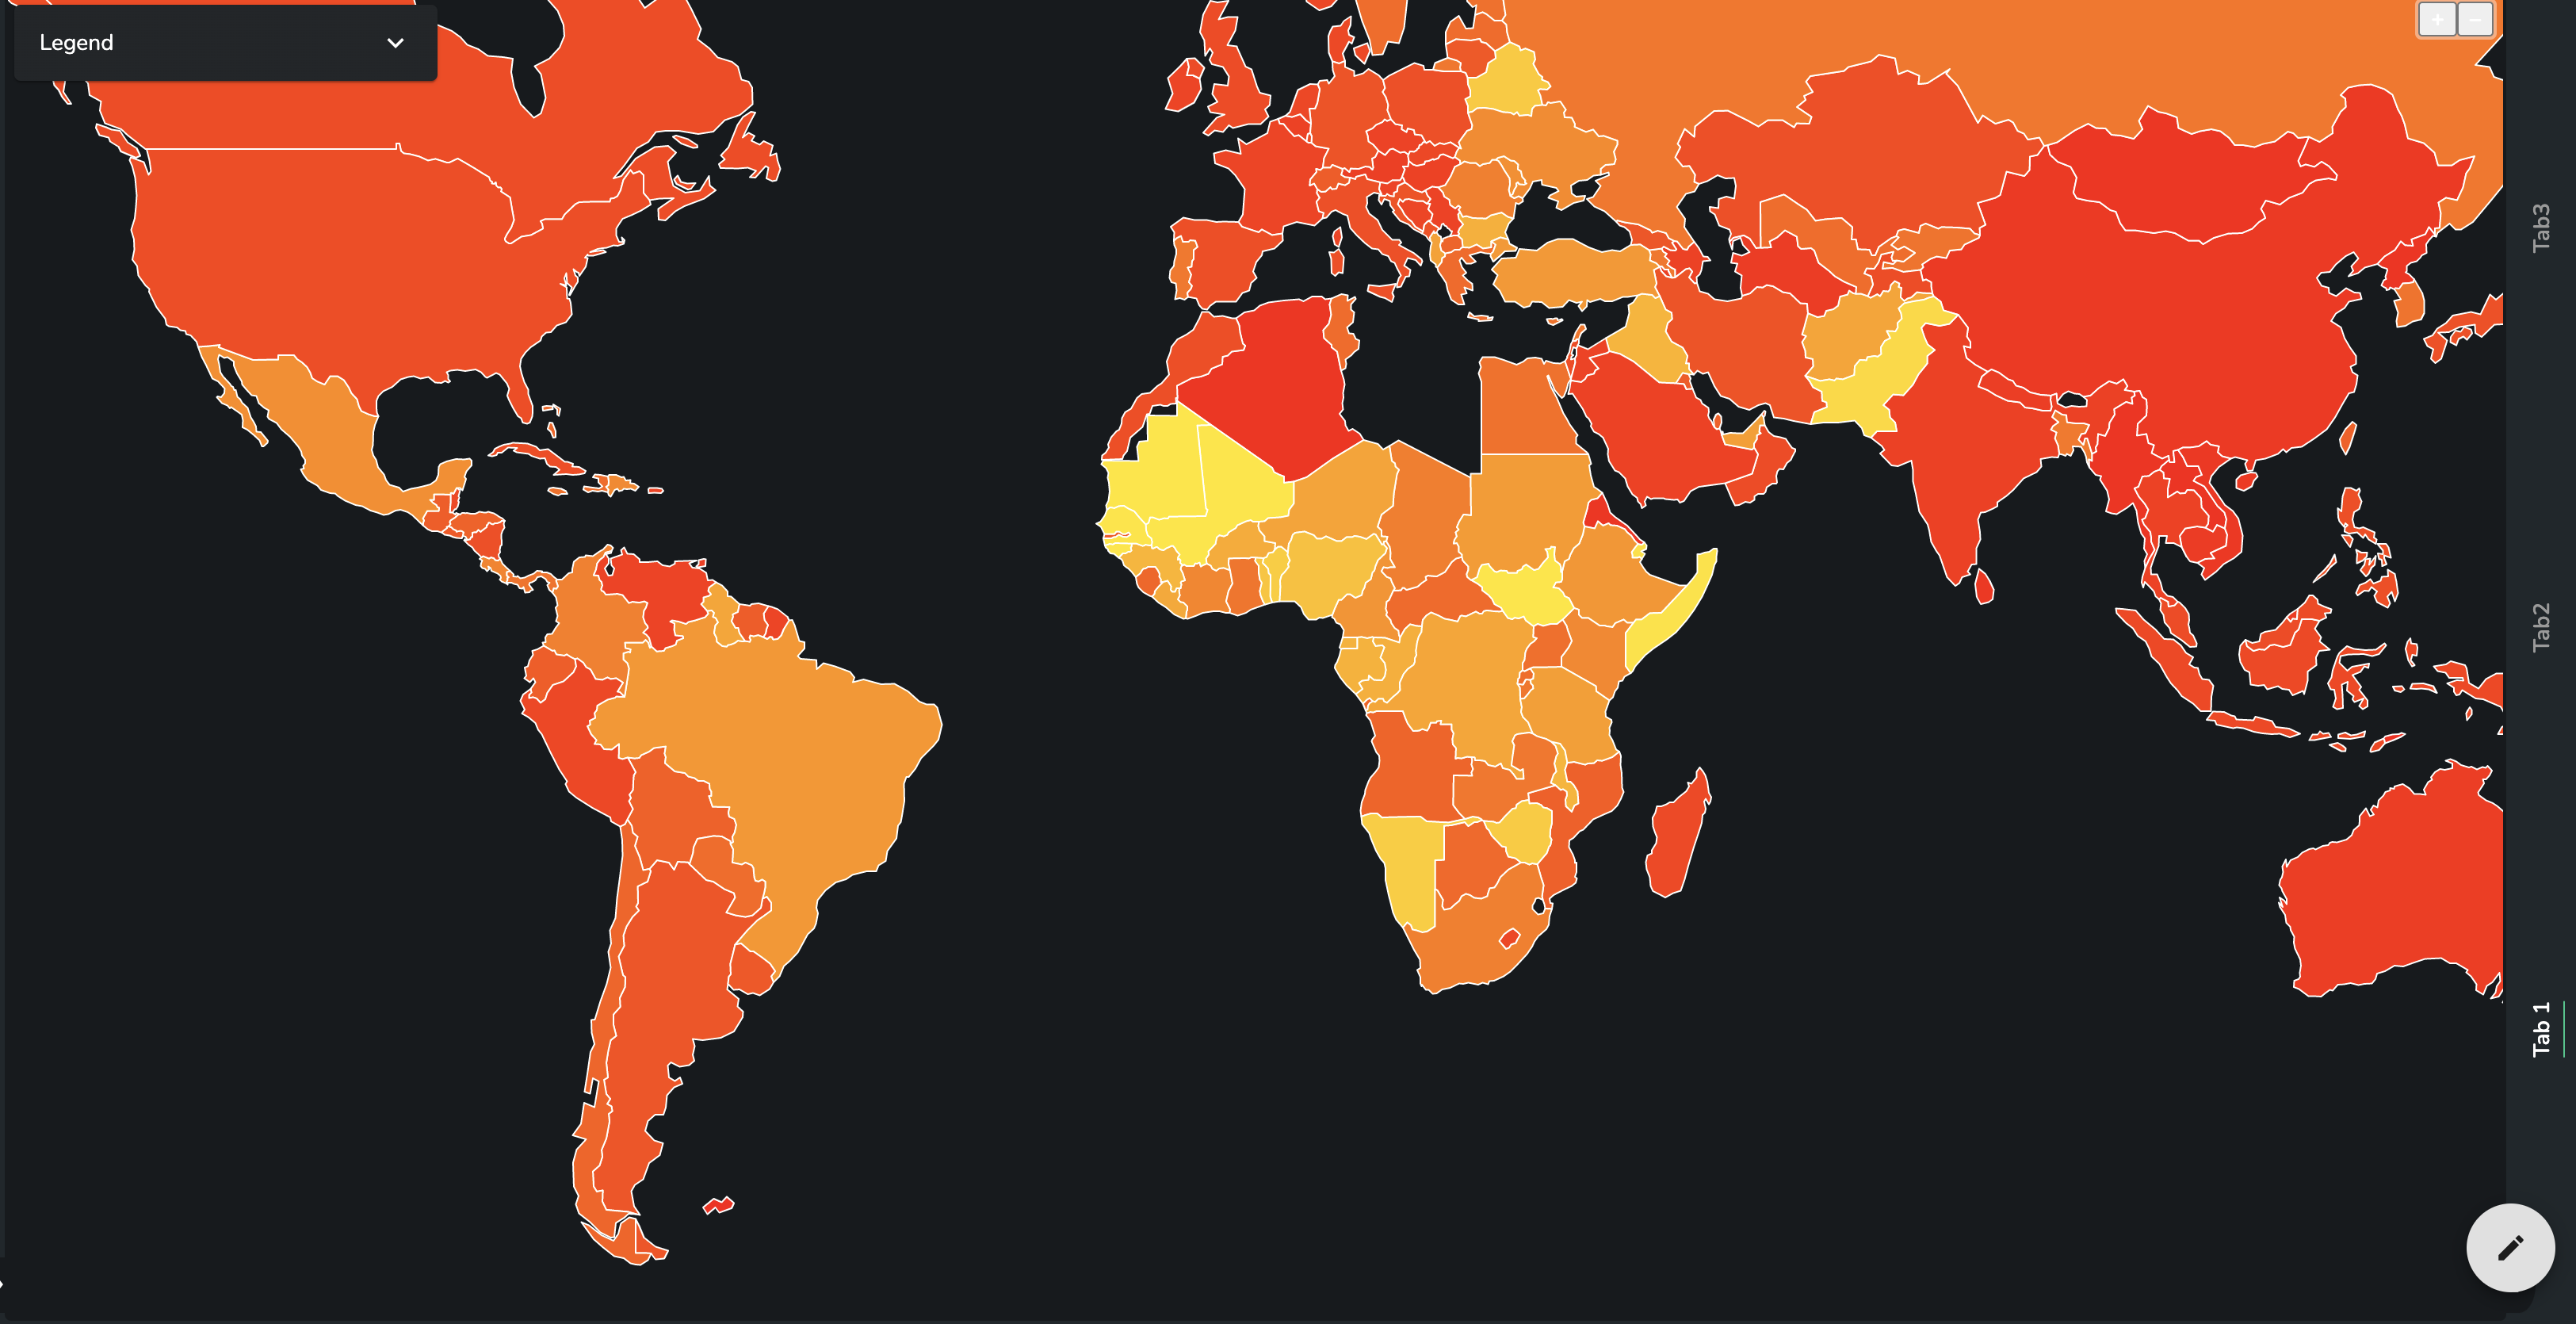
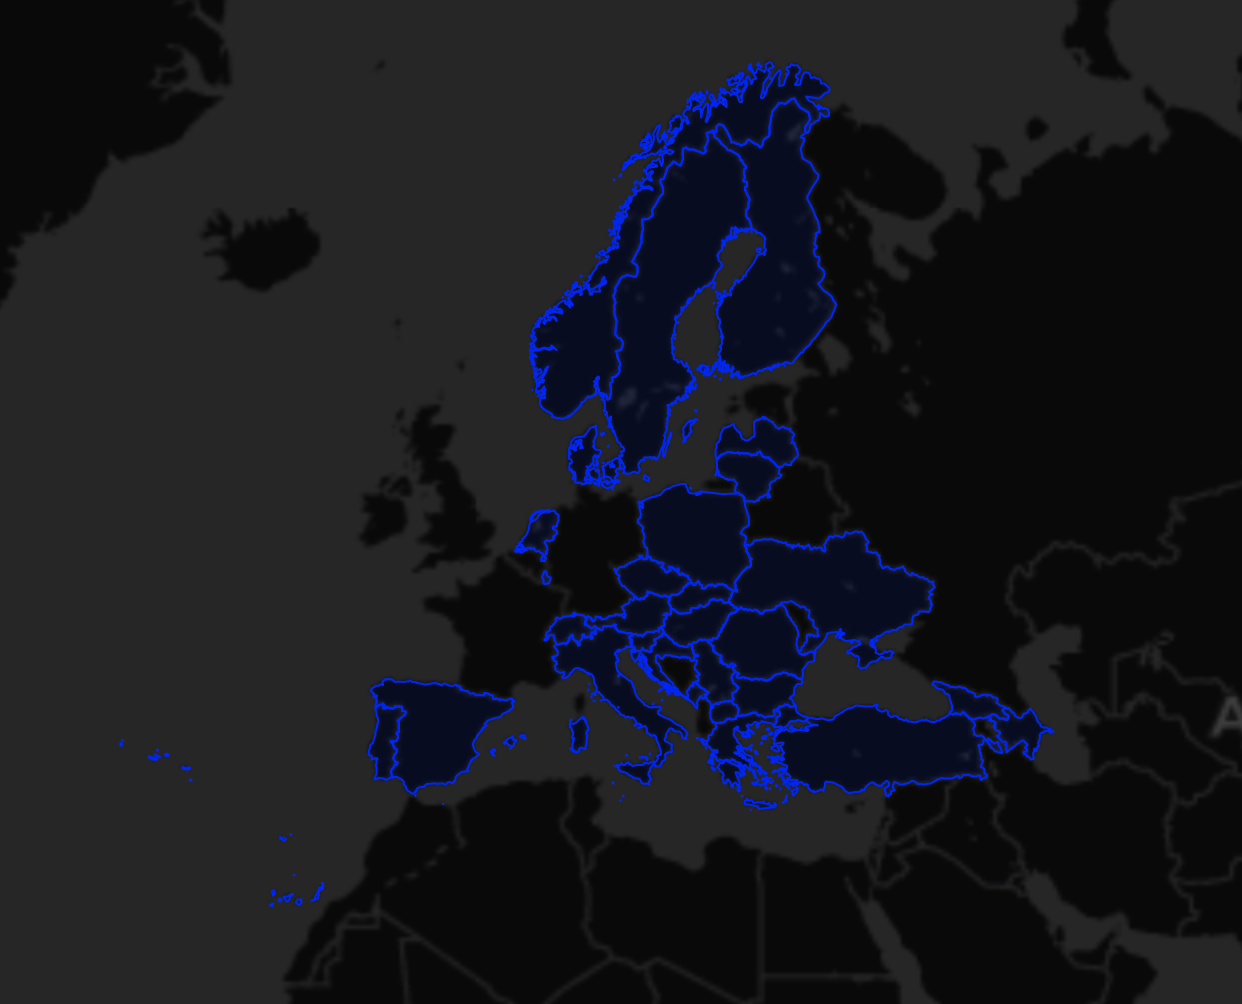
Example Choropleth Map
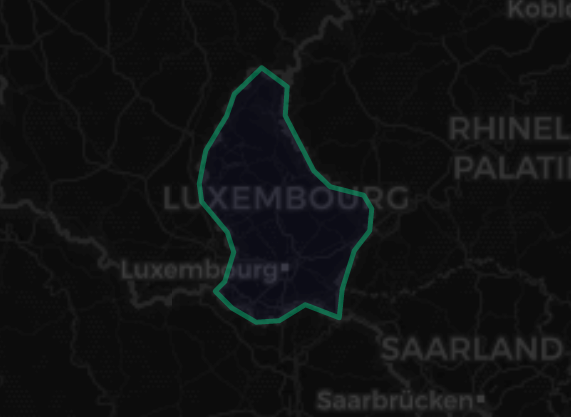
In order to add a choropleth map layer like the below, the user needs to set the following properties:
Layer type-ShapesShape Data Format-GeoJSONShape Data- use the sample data belowData ID Key-NAME_ENGL
{
  "type":"FeatureCollection",
  "features":[
    {
      "type":"Feature",
      "id":"b8217b9a-16a9-45e3-b4b8-c0a1ae0da230",
      "properties":{
        "id":"LU",
        "age":32.1,
        "NAME_ENGL":"Luxembourg"
      },
      "geometry":{
        "type":"Polygon",
        "coordinates":[
          [
            [
              6.13766,
              50.12995
            ],
            [
              6.12792,
              50.04735
            ],
            [
              6.25336,
              49.89093
            ],
            [
              6.32671,
              49.84497
            ],
            [
              6.47496,
              49.82127
            ],
            [
              6.51109,
              49.7828
            ],
            [
              6.50101,
              49.71871
            ],
            [
              6.43277,
              49.662
            ],
            [
              6.38005,
              49.5511
            ],
            [
              6.36711,
              49.46951
            ],
            [
              6.21562,
              49.50761
            ],
            [
              6.10166,
              49.46035
            ],
            [
              5.99994,
              49.45622
            ],
            [
              5.89339,
              49.49694
            ],
            [
              5.81812,
              49.54631
            ],
            [
              5.86082,
              49.57352
            ],
            [
              5.89907,
              49.65741
            ],
            [
              5.87145,
              49.71509
            ],
            [
              5.75895,
              49.8017
            ],
            [
              5.74632,
              49.85359
            ],
            [
              5.77586,
              49.94787
            ],
            [
              5.86883,
              50.04735
            ],
            [
              5.90124,
              50.10846
            ],
            [
              6.0249,
              50.18278
            ],
            [
              6.13766,
              50.12995
            ]
          ]
        ]
      }
    }
  ]
}
Complex Layers
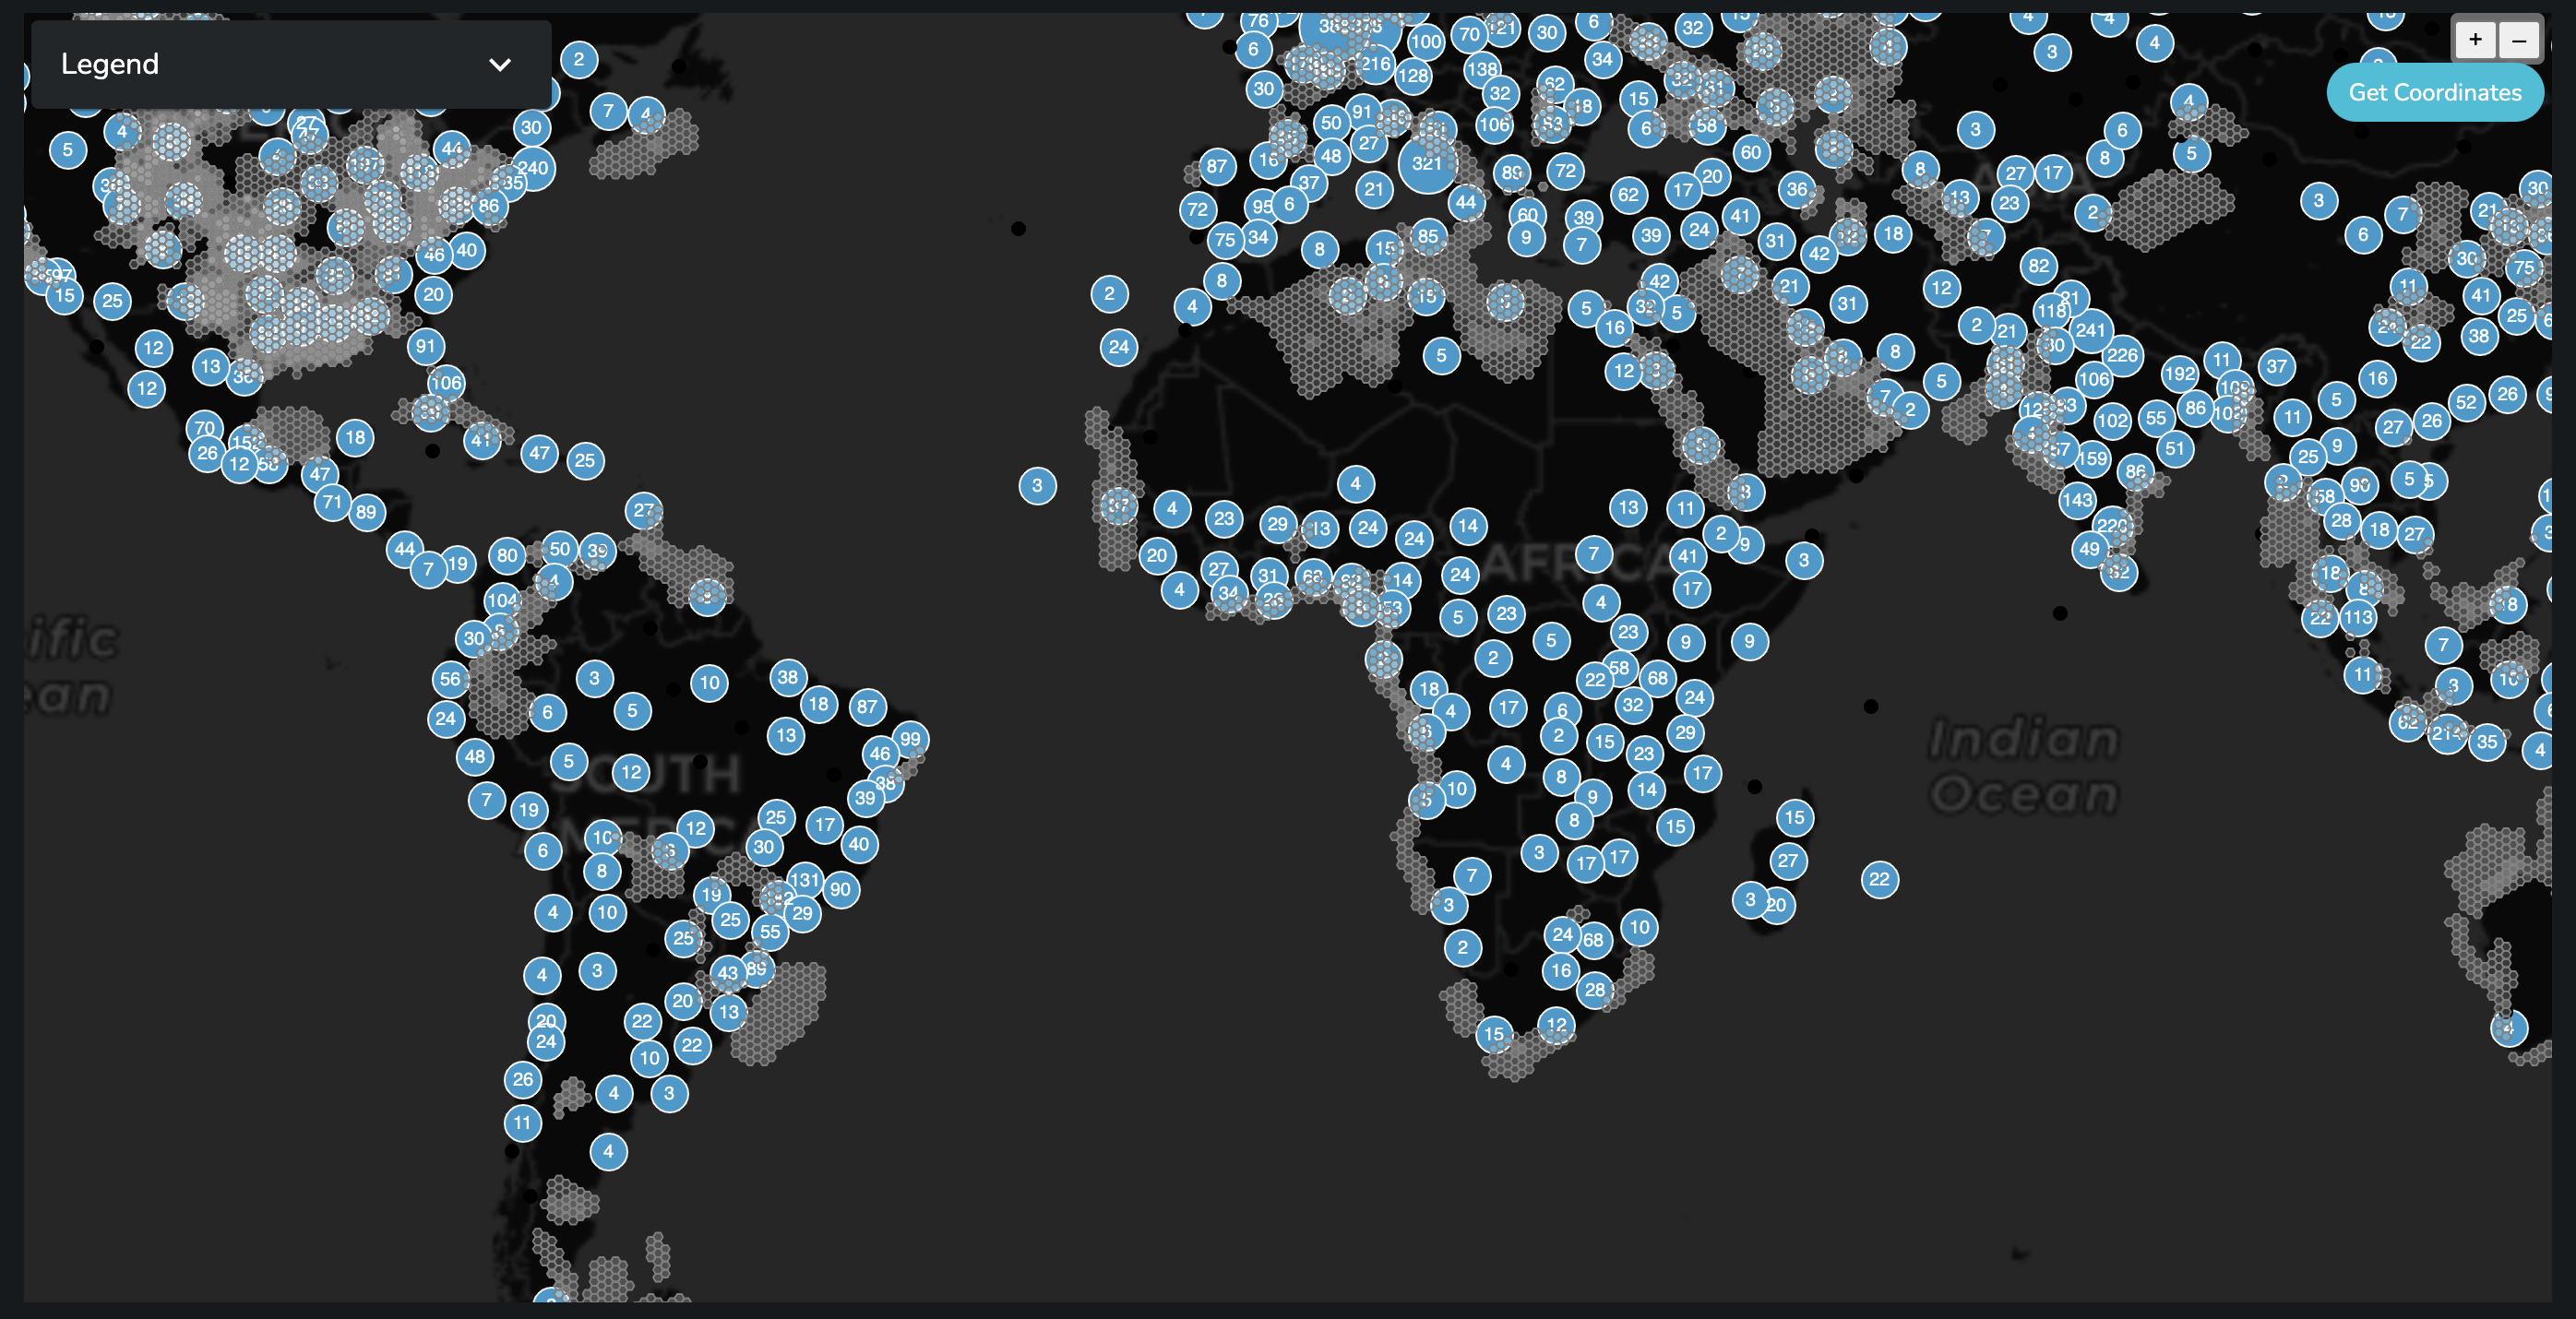
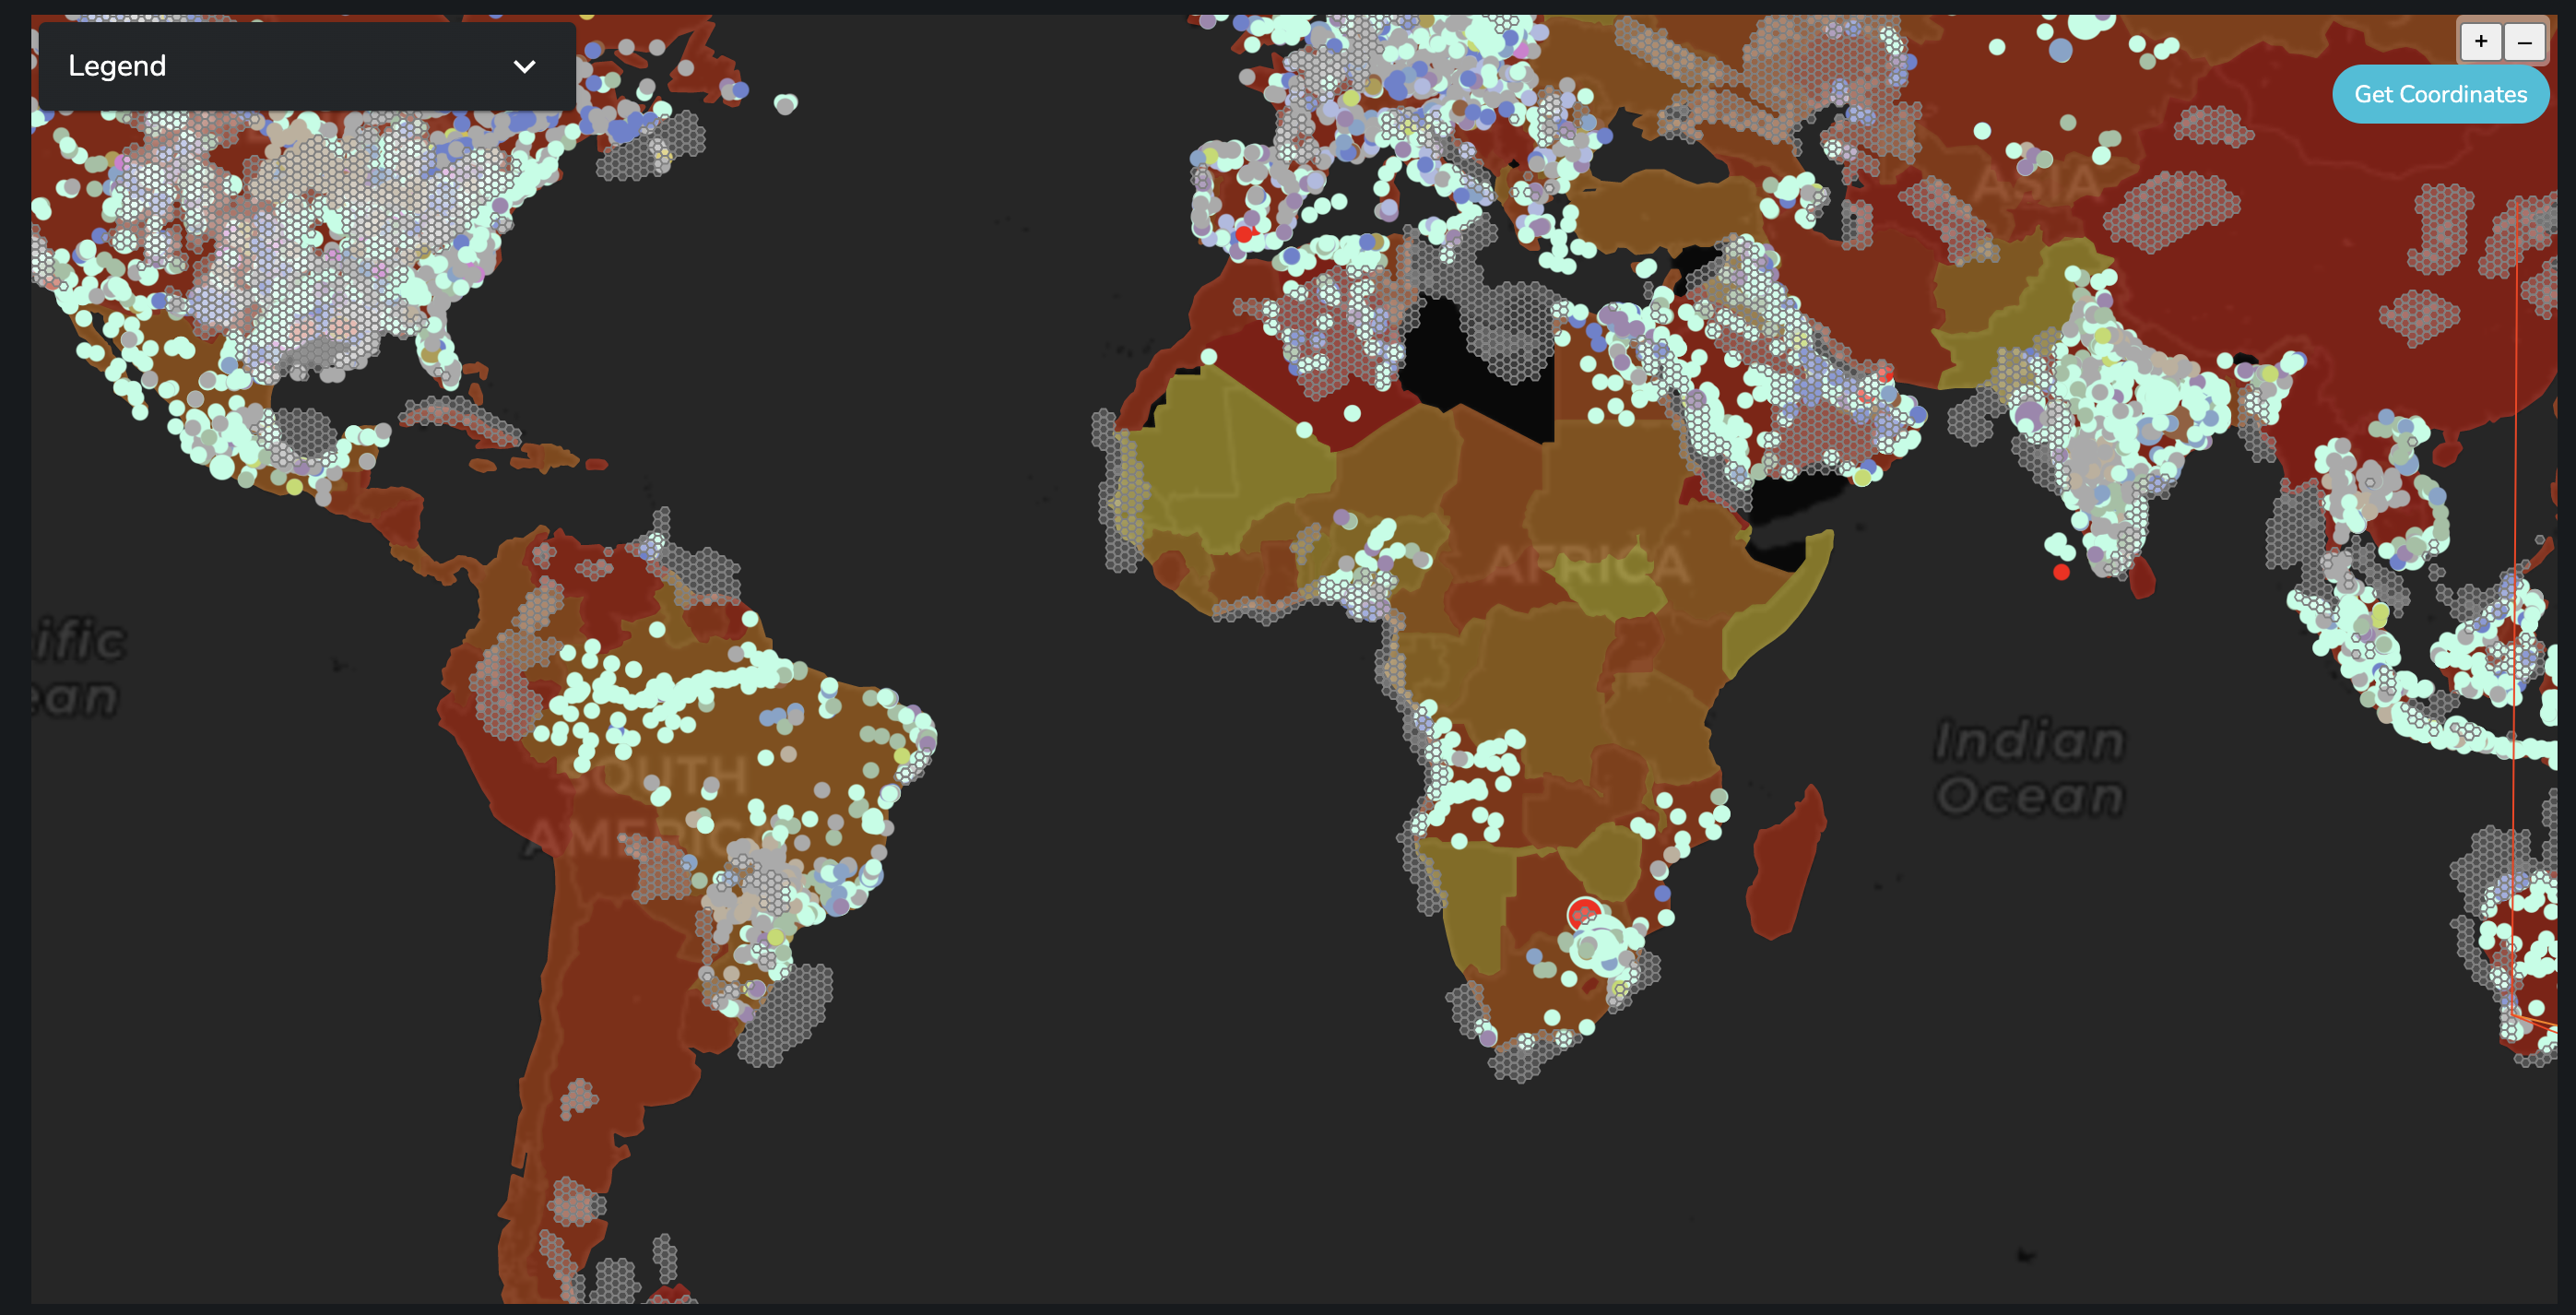
The user can combine different layers creating complex Map data.
Zoom Locations
Custom zoom locations can be used for the map that allow clicking and zooming into specific areas of the map with a click on a button.

The data for zoom locations needs to contain the name which is shown as the label. The location that contain the coordinates. And the zoomLevel that indicates how close up the zoom should be.
[
  {
    "name": "Reset",
    "location": [
      39,
      34
    ],
    "zoomLevel": 2
  },
  {
    "name": "Wroclaw",
    "location": [
      51.0636,
      17.0157
    ],
    "zoomLevel": 6
  },
  {
    "name": "Alaska",
    "location": [
      63.327384,
      -155.187037
    ],
    "zoomLevel": 4
  },
  {
    "name": "Hawaii",
    "location": [
      20.979907,
      -157.49664
    ],
    "zoomLevel": 8
  },
  {
    "name": "US Mainland",
    "location": [
      39.789582,
      -98.54167
    ],
    "zoomLevel": 4
  },
  {
    "name": "Australia",
    "location": [
      -25.3444,
      131.0369
    ],
    "zoomLevel": 4
  }
]